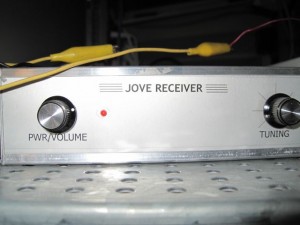
For my home observatory, I started with the Radio Jove receiver from NASA’s Radio Jove Project.
This was a fairly easy-to-build kit with great directions, not just for the receiver but also the antenna setup and installation. Unfortunately, I don’t have enough space to put up a phased antenna array. Also, I’m bordered by power lines on the north and south sides of my property. Also, since I’m in an urban area, I knew that I’d pick up a lot of noise. Not to worry. Solar observations are also quite interesting, and since the Sun is such a good signal source (especially so far this year), I opted for an antenna in my attic.
The basic components of my system are the Radio Jove receiver, a set of integration circuits, a digitizer and some software to process the data.

Radio Jove Receiver
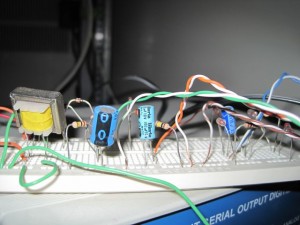
For the integration circuits, I’ve tried a few different versions. As I like to keep tinkering, the current integration circuits are on a breadboard.

Integration circuits: diode with resistor/capacitor combinations
I chose the 16-bit digitizer from Webtronics.

Digitizer
I chose this digitizer for a few reasons. Many Radio Jove(RJ) observers use their computer sound cards and some processing software. As that software only runs on Windows and I wanted to run this on a headless (no monitor, keyboard or mouse), I opted for a solution running on Unix or Linux. For my day job, I work at the University of Utah Seismograph Stations. We’ve been using the Webtronics digitizers for a while in remote locations to process seismic data. Further, I opted to use some of our seismic data acquisition and plotting software to produce graphics of the data I collected.

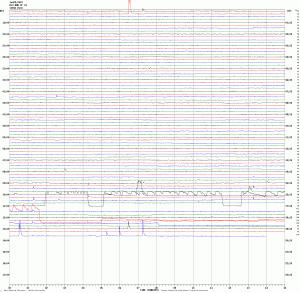
Helicorder output from digitizer and receiver above
For those of you who’ve seen the traditional earthquake helicorder, this might look almost familiar. The chart shows 24 hours of data, in 15-minute horizontal traces. The colors are just used to differentiate the 15-minute slice. Times in standard time are on the left side, in UTC on the right. On the extreme right is a DC offset. In order to keep the traces from jumping all over the image, data for the first 1-2 minutes are used to determine a DC offset to bring the trace back on center. Which is why there are traces that jump up for a while and then later seem to drop off. If you look at the DC offset values, you’ll see a large signal was observed for part of that time.


